Google Analytics is a must-have tool for any online entrepreneur. If you care about improving the user experience, getting more customers, and understanding how to improve your website, you should install this free tool.
There are good alternatives to Google’s analytics software, but Google Analytics (GA) is free, it has the power of Google (Alphabet) behind it, and it’s easy to install and get started. The analytics tool has power in depth and is capable of incredibly complex reporting. But you don’t need all that if you’re just starting or you haven’t even installed the tracking code. Here’s a beginners guide to setting up the basics.
Installing Google Analytics
This is easier than most people think. If you’re not “technical”, then with a bit of luck you’re using WordPress. With the most popular content management system in the world, WordPress, it’s easier to add code to your website. You don’t need a developer if you follow these steps.
Set Up Google Analytics
Go to analytics.google.com and sign up for an account. You will need a Gmail account.
Click tracking ID and accept the terms & conditions.
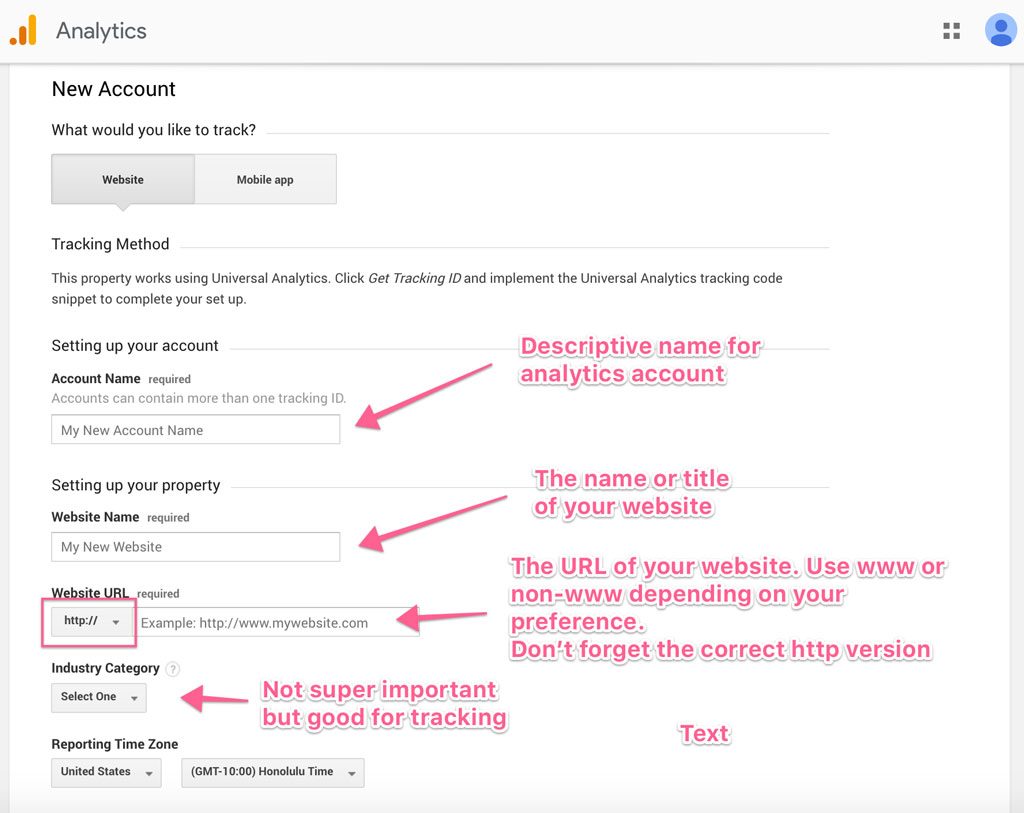
The following screen is where you’ll be presented with the Google Analytics Tracking ID. This is a short piece of code that needs to be places on your website.
Adding the code to the <HEAD> of every webpage is essential.The <HEAD> is a section of HTML code near the top of every web page on your site. How you add code to this section depends on the architecture of your website.
Install The Tracking Code
WordPress Users:
Copy the code in GA by selecting it and hitting Command and C on Mac (or CTRL and C on PC).
For users of the excellent Genesis framework, adding the GA code is easy. Navigate to Genesis > Theme Settings in your WordPress Admin. Once there, scroll down to Header Scripts and paste in the code.
For users of the WordPress themes from Elegant Themes, navigate to the Theme name (Divi, for example) and click Theme Options. Click the Integration tab and paste the code in the text area beside “Add code to the < head > of your blog”.
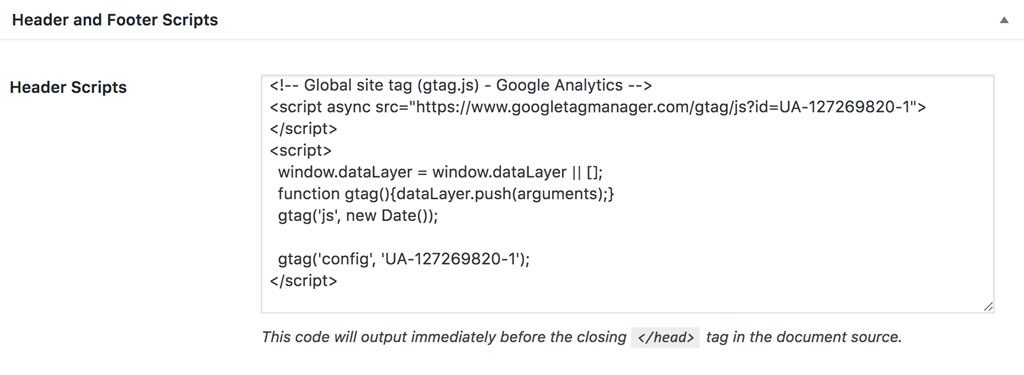
For other WordPress theme users, the easiest way to perform this task is to install the Header and Footer Plugin, a free plugin from the WordPress repository.
Once installed, go to the Settings section of the WordPress Admin and select Header and Footer. Paste the GA code into the <Head> SECTION INJECTION area.
Don’t forget to click save after making changes on any of these platforms.
Shopify Users:
Go to the Online Store > Preferences section of the Shopify administration panel.
On the right-hand side, scroll down to the “Google Analytics” section. Paste the code and click Save.
Verify The Tracking Code
To check that Analytics is working, head back to the Google Analytics console.
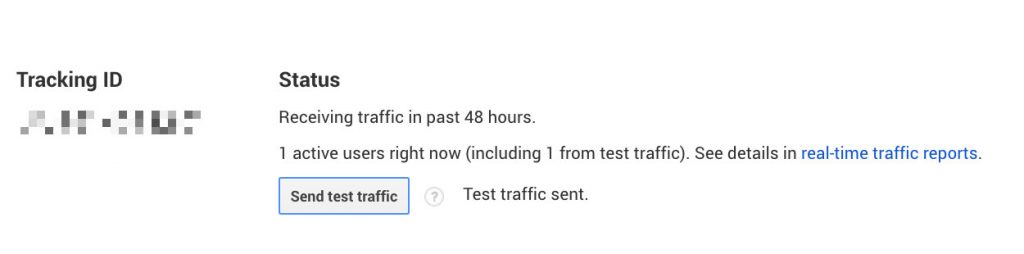
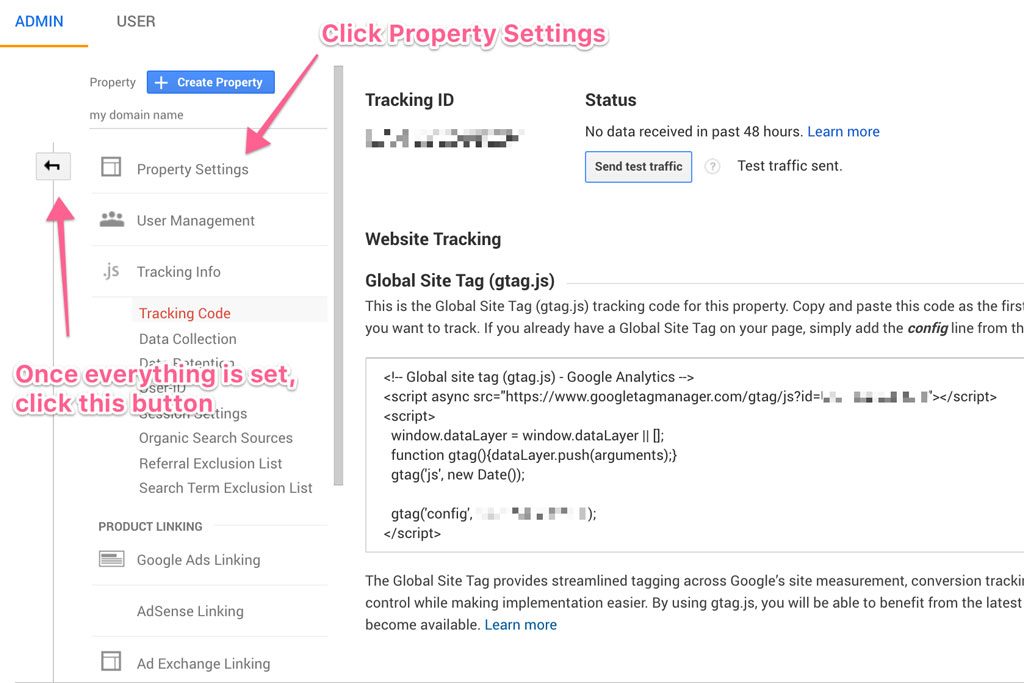
Refresh the page a few times and look for the “Send Test Traffic” button below the Status area. Click this button and a new window will appear. This represents test traffic to your site. If Google Analytics can read the code properly, the “active users right now” section should show a 1 (or more) instead of 0.
Configure basic analytics tracking features
Now lets look deeper at the analytics configuration.
Click Property Settings in the Admin console.
Check that the property settings look okay. Make sure the correct http: or https: configuration is set correctly.
Scroll down to Enable Demographics and Interest Reports and click the button that currently shows OFF. It should change to ON. Click Save. This gives us more accurate reports on the users that visit the site.
Click the back arrow (see above image) to the left of the admin panel or click the Admin cogwheel near the bottom left of the screen to return to the main page of the Google Analytics Administration.
In the third column (called View), click View Settings.
Change the View name to something more descriptive, like “MyDomain.com All Traffic”.
Double check the website’s URL.
If your website uses a search feature, it’s worth changing the Site search Tracking to ON and adding the query parameter. You can find this by using the search function on the website and seeing what’s returned in the address bar.
For example, if I search for the word marketing on fatfrogmedia.com’s search bar the URL returned is https://fatfrogmedia.com/?s=marketing
The query parameter is the letter s
Do the same for your site, enter the query parameter, and save.
Understand Simple Reports
Porter Metrics offers beautiful and free Google Data Studio templates that present all the analytics and SEO data you might need in an easy-to-understand format. Great for client reporting or in-house reports.
Check out these other analytics reporting tools to connect Google Analytics and countless other reporting tools in one interface. Make better decisions with better data!
It takes time before you can read meaningful reports from the tool. Actual data is reported a day behind but you can see live visits in the real-time section.
After a week or more of Google collecting data, you can start looking for useful statistics. The best data comes after a couple of months. Then you can see what’s working and what’s not working compared to the previous month(s).
The Audience > Overview report is one of the best places to start. Here you can see a graph or chart of your visitors over the month. The Number of Sessions per User, Pages / Session, and Avg. Session Duration statistics are incredibly useful.
The Acquisition > All Traffic > Channels report is an overview of the traffic channels providing traffic to the website.
This report will generally show 5 or 6 different channels
- Organic Search – Traffic from Google, Bing, and other search engines.
- Social – Traffic from Facebook, Pinterest, Twitter, and other social media platforms.
- Direct – Traffic from visitors that use bookmarks or type your domain into their web browser’s address bar.
- Referral – Traffic from other websites on the internet via links on their pages.
- Email – Traffic from email clicks.
- Paid Search – Traffic from Pay Per Click (PPC) campaigns such as Google Ads or Facebook Ads.
The Behaviour > Site Content > All Pages report is great for understanding which pages are performing well. If your most important pages are not in the top ten, check the Avg. Time on Page and the % Exit numbers to see if people are leaving in a hurry.
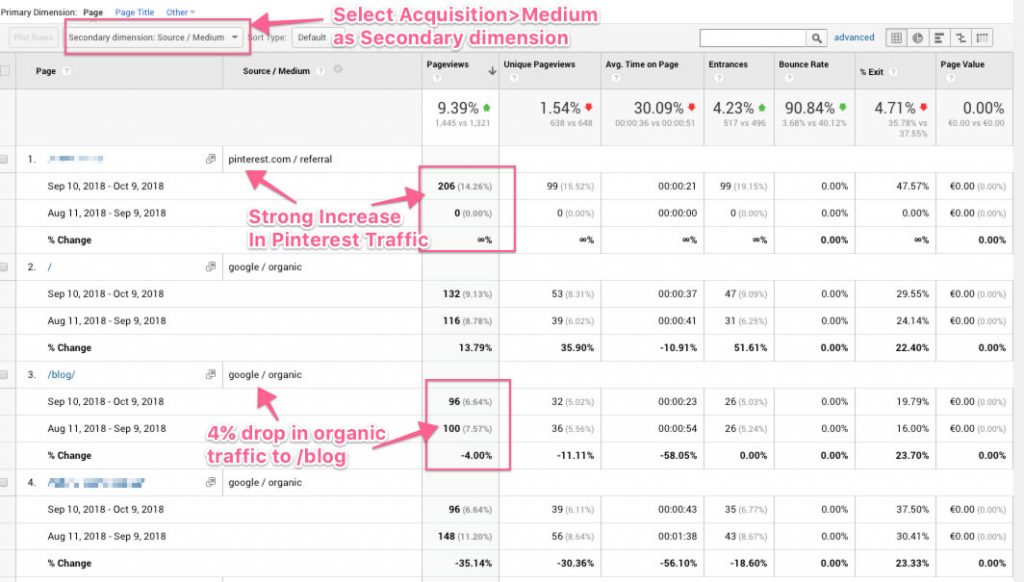
Click the Secondary Dimension button and choose Source / Medium (under Acquisition) to see what source of traffic is the performing well for each page. Compare to the previous month to see things have changed.
Use Reports To Improve Your Website
Use the Audience > Overview report and compare the data to the previous month to see how your website is performing. If the number of users has declined or the bounce rate has increased, for example, there might be a problem with the website worth investigating.
If you see that social is driving a lot of traffic, look to see which posts, pins, or tweets are sending traffic. Make a note of when traffic arrives and from what source. Adjust your content marketing to focus on what’s currently getting engaged visitors to your website.
Check the organic traffic graphs to see if posts or pages on your website are decreasing in traffic numbers each month. If you spot any problems, combine this report with other reports to see what might cause the drop in traffic. Do the pages have high bounce rates? Are people spending little time on a blog post? If so, Google might rank the pages lower in search, resulting in fewer clicks and less traffic.
If you want to find some great keyword topics to use on your website, you can start by checking what people are actually looking for. Check the analytics for site searches and discover what your audience wants you to write about. Here’s a video that explains this idea:
There are further configurations in Google Analytics that give you a lot more data on your users. If you have an Ecommerce store, it’s worth setting up Ecommerce tracking too. But this guide will get you up and running with the easiest to configure settings. Once you’re used to reading reports in GA and navigating the control panel, it will be easier to move on to more complicated tracking.
Conversion tracking is a great way to see what sources of traffic and visitors are buying your products, signing up for your services, or simply reading your most important landing pages.